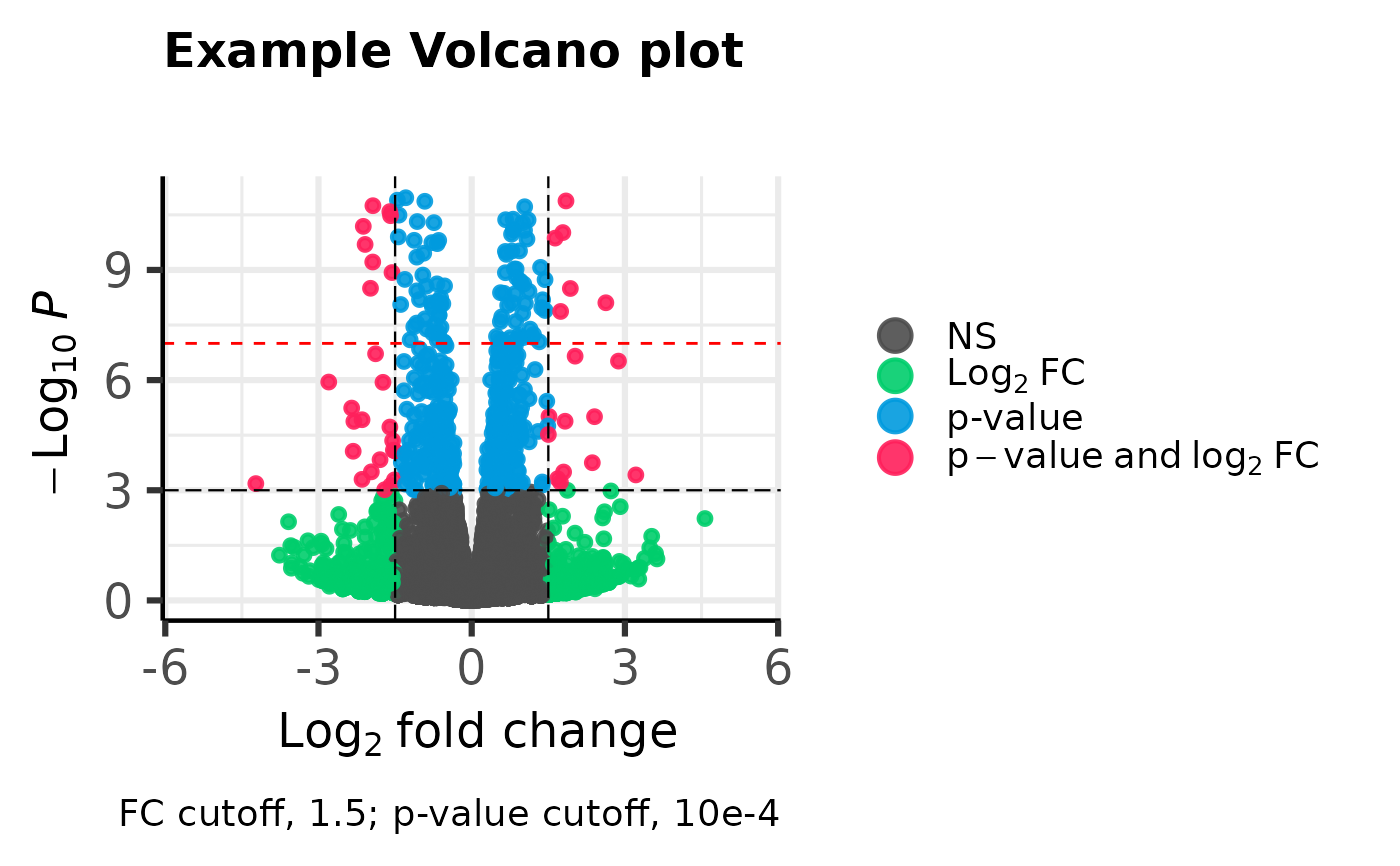
Creates a volcano plot to visualize differential expression results. This function is highly configurable to suit publication standards.
Usage
ggvolcano(
  data,
  labels = "",
  logFC_col,
  pval_col,
  x_limits = NULL,
  y_limits = NULL,
  xlab = bquote(~Log[2] ~ "fold change"),
  ylab = bquote(~-Log[10] ~ italic(P)),
  title = "Volcano plot",
  subtitle = "",
  caption = paste0("total = ", nrow(data), " variables"),
  pval_cutoff = 1e-06,
  logFC_cutoff = 1,
  cutoff_line = list(type = "longdash", color = "black", width = 0.4),
  point_aes = list(size = 1.5, shape = c(19, 19, 19, 19), color = c("grey30", "#00CD6C",
    "#009ADE", "#FF1F5B"), alpha = 0.9),
  label_aes = list(size = 2.5, color = "black", face = "plain", parse = FALSE),
  legend_aes = list(labels = c("NS", expression(Log[2] ~ FC), "p-value", expression(p -
    value ~ and ~ log[2] ~ FC)), position = "right", label_size = 14, icon_size = 5),
  shade_options = NULL,
  connector_aes = list(line_width = 0.5, arrow_type = "closed", arrow_ends = "first",
    arrow_length = unit(0.01, "npc"), line_color = "grey10", direction = "both",
    draw_arrowheads = TRUE),
  gridlines = list(major = TRUE, minor = TRUE),
  plot_border = "partial",
  border_width = 0.8,
  border_color = "black",
  horizontal_line = NULL,
  horizontal_line_aes = list(type = "longdash", color = "black", width = 0.4)
)
Arguments
- data
A data frame containing test statistics. Requires at least columns for variable names, log2 fold changes, and p-values.
- labels
Column name, `"rownames"`, a single label, or one label per row.
- logFC_col
Column name for log2 fold changes.
- pval_col
Column name for nominal or adjusted p-values.
- x_limits
Limits of the x-axis (default auto-calculated).
- y_limits
Limits of the y-axis (default auto-calculated).
- xlab
X-axis label.
- ylab
Y-axis label.
- title
Plot title.
- subtitle
Plot subtitle.
- caption
Plot caption.
- pval_cutoff
P-value cutoff for significance.
- logFC_cutoff
Log2 fold-change cutoff for significance.
- cutoff_line
List of options for cutoff lines (`type`, `color`, `width`).
- point_aes
List of aesthetic options for points (`size`, `shape`, `color`, `alpha`).
- label_aes
List of aesthetic options for labels (`size`, `color`, `face`, `parse`).
- legend_aes
List of aesthetic options for legend (`labels`, `position`, `label_size`, `icon_size`).
- shade_options
List of options for shading regions in the plot.
- connector_aes
List of aesthetic options for connectors (`line_width`, `arrow_type`, `arrow_ends`, `arrow_length`, `line_color`, `direction`, `draw_arrowheads`).
- gridlines
List with logical values indicating whether to draw gridlines (`major`, `minor`).
- plot_border
Add a border for plot axes (`"partial"` or `"full"`).
- border_width
Width of the border.
- border_color
Color of the border.
- horizontal_line
Numeric value(s) for drawing horizontal line(s).
- horizontal_line_aes
List of aesthetic options for the horizontal line(s) (`type`, `color`, `width`).
Examples
data <- read.csv(system.file("extdata", "example.csv", package = "ggvolcano"))

ggvolcano(data,
  logFC_col = "log2FoldChange",
  pval_col = "pvalue",
  pval_cutoff = 10e-4,
  logFC_cutoff = 1.5,
  x_limits = c(-5.5, 5.5),
  y_limits = c(0, -log10(10e-12)),
  title = "Example Volcano plot",
  caption = "FC cutoff, 1.5; p-value cutoff, 10e-4",
  gridlines = list(major = TRUE, minor = TRUE),
  horizontal_line = 10e-8, # Draw horizontal line for p-value cutoff
  horizontal_line_aes = list(type = "dashed", color = "red", width = 0.5)
)