Using ggvolcano for Publication-Ready Volcano Plots
Yaoxiang Li
2017-01-05
Source:vignettes/ggvolcano-examples.Rmd
ggvolcano-examples.RmdIntroduction
This vignette demonstrates various ways to create and customize
volcano plots using the ggvolcano function. Each example
below highlights different aspects of customization—from basic plotting
to modifying point aesthetics, labels, gridlines, and legends—to produce
publication-ready plots.
Example 1: Basic Volcano Plot
Load the example data and create a basic volcano plot with default aesthetics and thresholds.
data <- read.csv(system.file("extdata", "example.csv", package = "ggvolcano"))

ggvolcano(data,
          logFC_col = "log2FoldChange",
          pval_col = "pvalue",
          pval_cutoff = 1e-6,
          logFC_cutoff = 1.0,
          title = "Basic Volcano Plot",
          caption = paste("Total variables:", nrow(data)))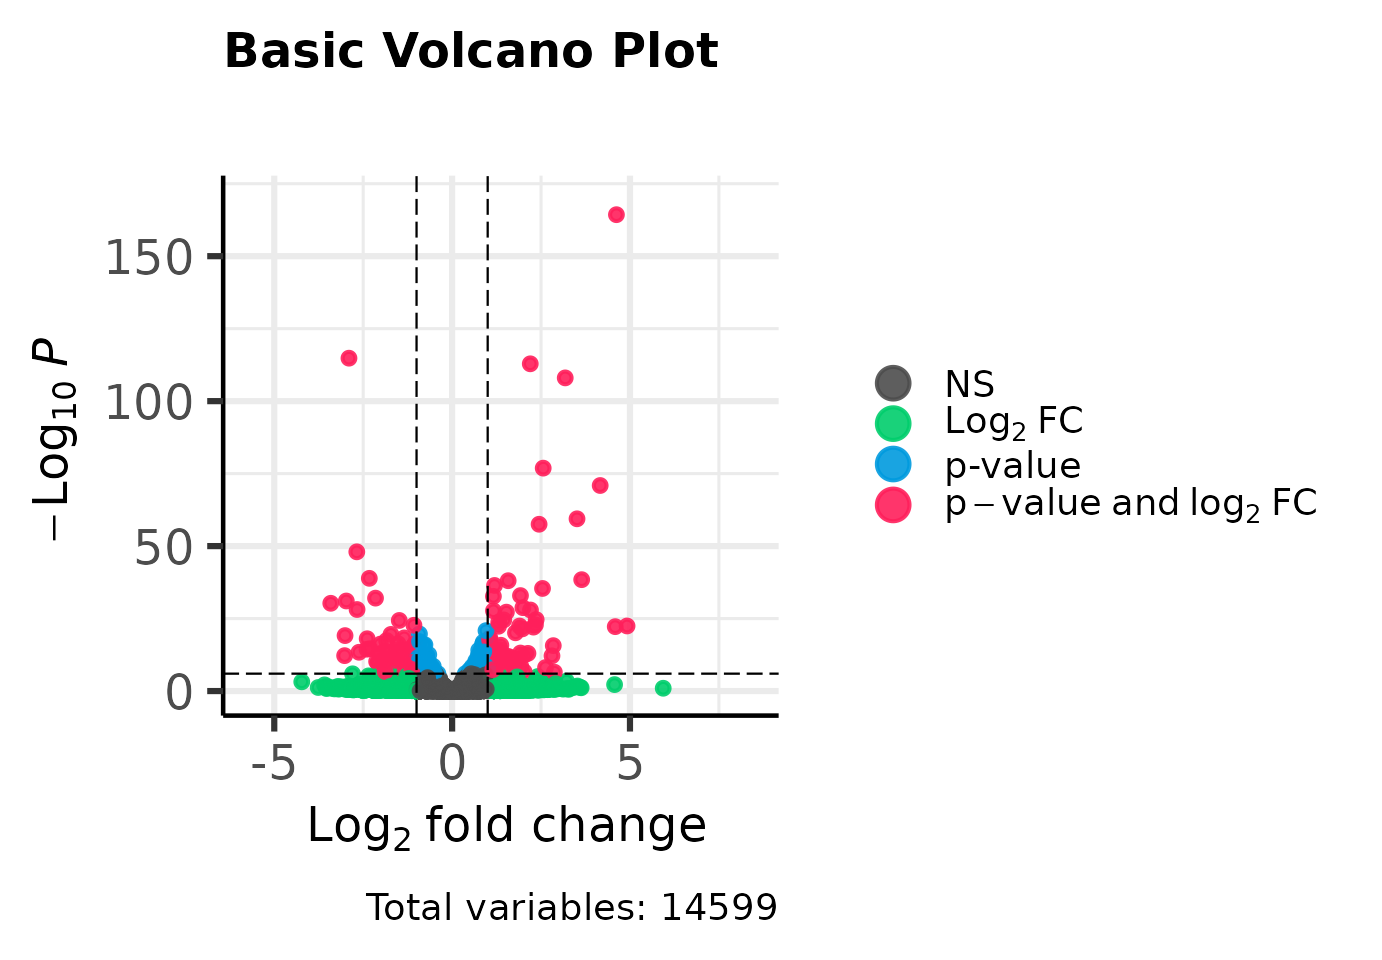
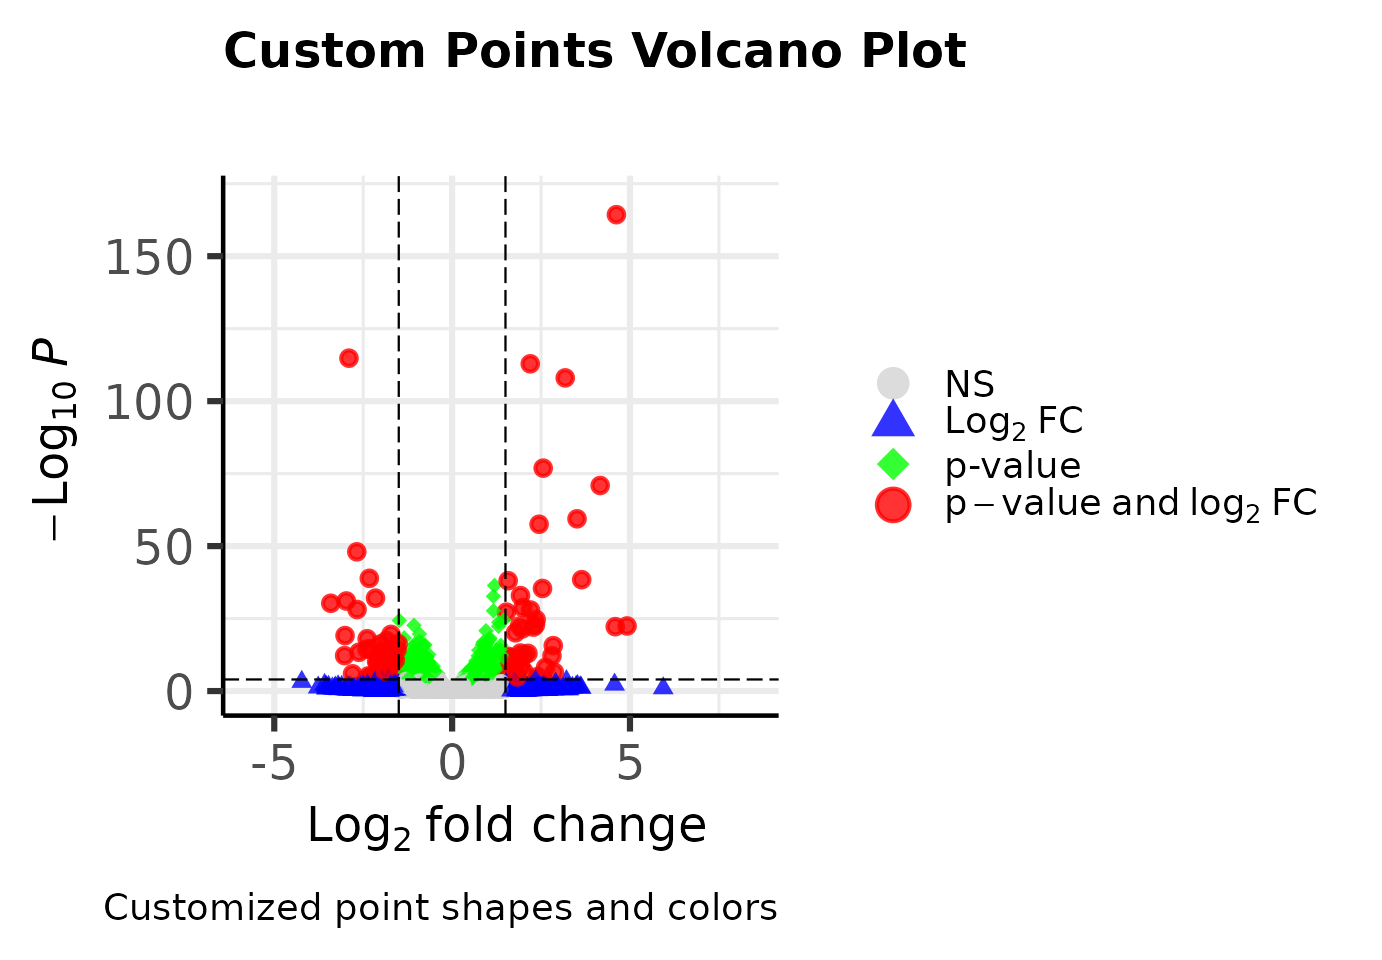
Example 2: Volcano Plot with Custom Point Aesthetics
Customize point shapes, colors, and sizes for a distinct visual style.
ggvolcano(data,
          logFC_col = "log2FoldChange",
          pval_col = "pvalue",
          pval_cutoff = 1e-4,
          logFC_cutoff = 1.5,
          title = "Custom Points Volcano Plot",
          caption = "Customized point shapes and colors",
          point_aes = list(
            size = 2,
            shape = c(16, 17, 18, 19),  # Different shapes for NS, FC, P, and FC_P
            color = c("lightgrey", "blue", "green", "red"),
            alpha = 0.8
          ))
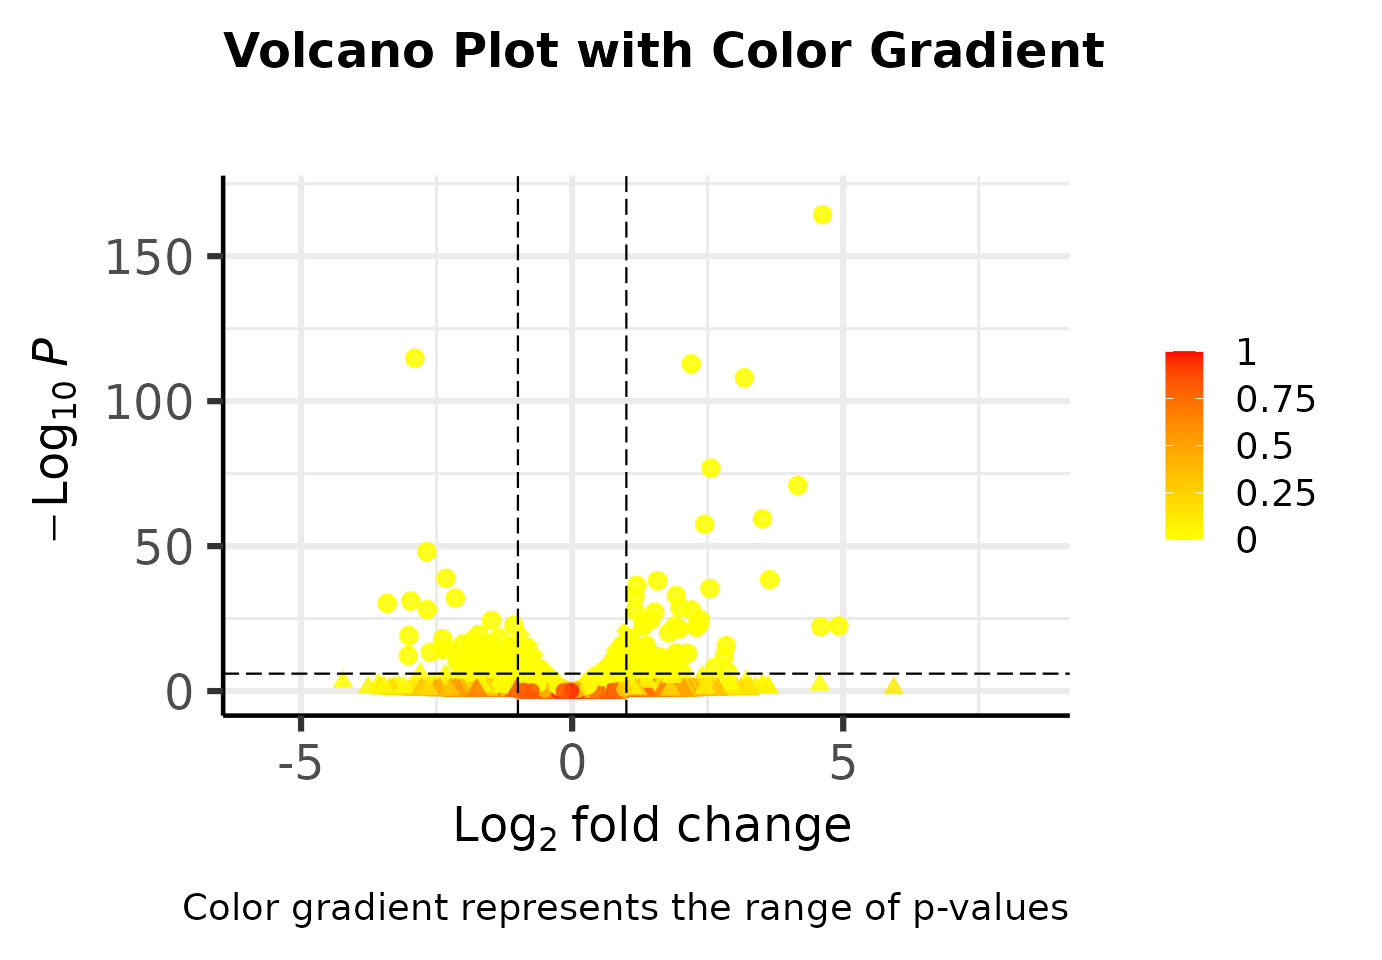
Example 3: Volcano Plot with Color Gradient
Apply a color gradient to the points to represent the range of p-values.
ggvolcano(data,
          logFC_col = "log2FoldChange",
          pval_col = "pvalue",
          pval_cutoff = 1e-6,
          logFC_cutoff = 1.0,
          title = "Volcano Plot with Color Gradient",
          caption = "Color gradient represents the range of p-values",
          point_aes = list(
            size = 2,
            shape = c(16, 17, 18, 19),
            alpha = 0.85,
            # Activate the color gradient by specifying two colors and associated options:
            color_gradient = c("yellow", "red"),
            color_gradient_limits = c(min(data$pvalue, na.rm = TRUE), max(data$pvalue, na.rm = TRUE)),
            color_gradient_breaks = seq(min(data$pvalue, na.rm = TRUE), max(data$pvalue, na.rm = TRUE), length.out = 5),
            color_gradient_labels = round(seq(min(data$pvalue, na.rm = TRUE), max(data$pvalue, na.rm = TRUE), length.out = 5), 3)
          ))
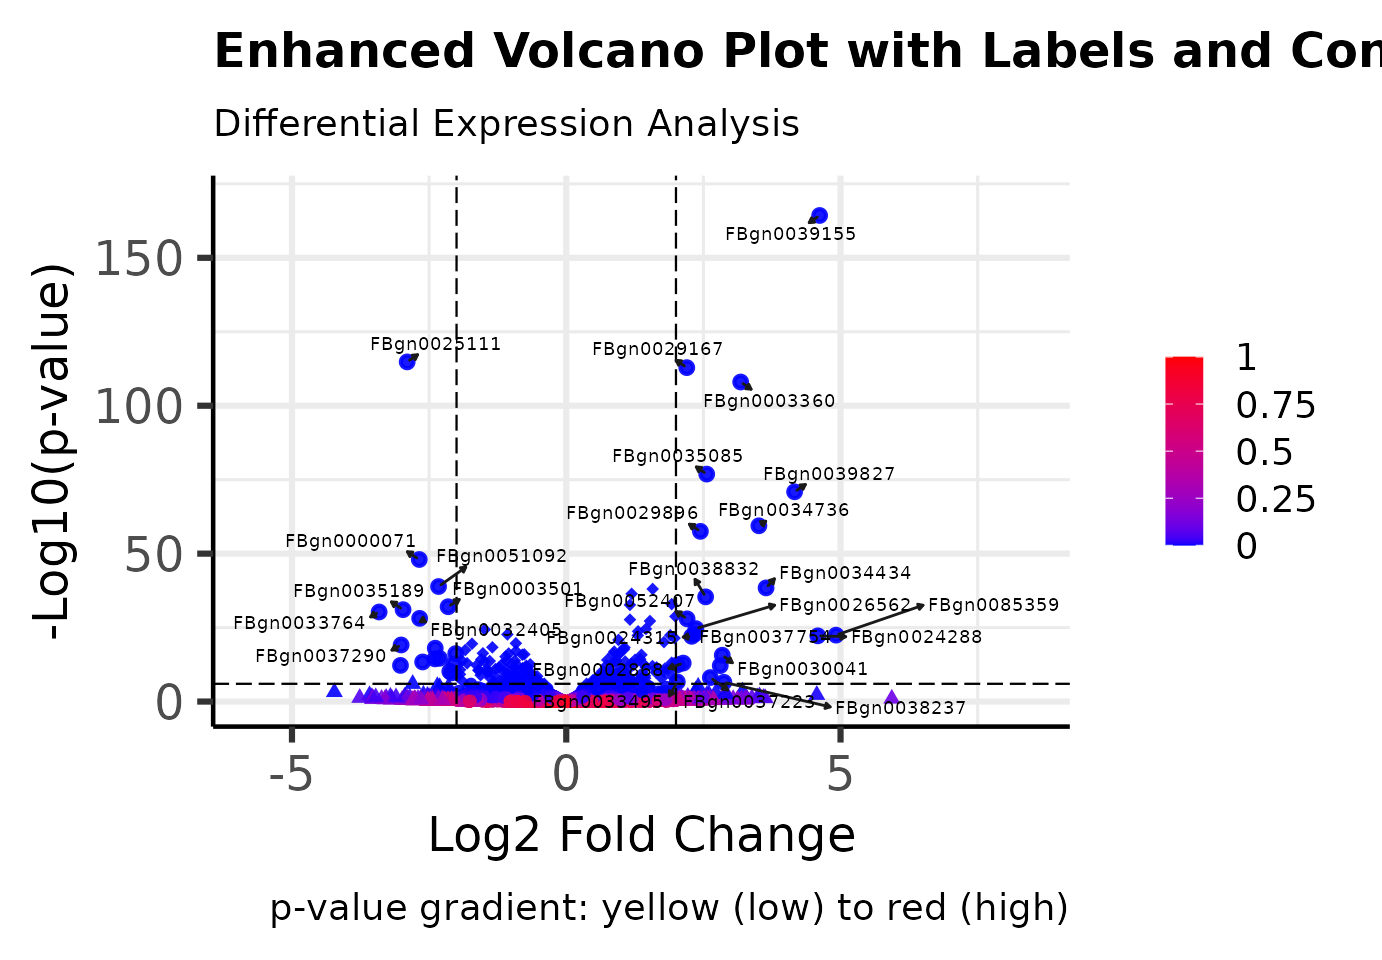
Example 4: Volcano Plot with Custom Labels and Connectors
Add custom labels (using column X) and connectors to highlight selected points.
ggvolcano(data,
          labels = data$X,            # Use the column 'X' for labels
          logFC_col = "log2FoldChange",
          pval_col = "pvalue",
          pval_cutoff = 1e-6,
          logFC_cutoff = 2.0,
          xlab = "Log2 Fold Change",   # Custom x-axis label
          ylab = "-Log10(p-value)",    # Custom y-axis label
          title = "Enhanced Volcano Plot with Labels and Connectors",
          subtitle = "Differential Expression Analysis",
          caption = "p-value gradient: yellow (low) to red (high)",
          point_aes = list(
            size = 1.5,
            shape = c(16, 17, 18, 19),
            alpha = 0.9,
            color_gradient = c("blue", "red"),
            color_gradient_limits = c(min(data$pvalue, na.rm = TRUE),
                                      max(data$pvalue, na.rm = TRUE)),
            color_gradient_breaks = seq(min(data$pvalue, na.rm = TRUE),
                                        max(data$pvalue, na.rm = TRUE),
                                        length.out = 5),
            color_gradient_labels = round(seq(min(data$pvalue, na.rm = TRUE),
                                              max(data$pvalue, na.rm = TRUE),
                                              length.out = 5), 3)
          ))
Example 5: Volcano Plot with Custom Gridlines and Full Border
Customize the gridlines and add a full border to the plot.
ggvolcano(data,
          logFC_col = "log2FoldChange",
          pval_col = "pvalue",
          pval_cutoff = 1e-4,
          logFC_cutoff = 1.5,
          title = "Volcano Plot with Custom Gridlines & Border",
          caption = "Major gridlines only; full border in blue",
          gridlines = list(major = TRUE, minor = FALSE),
          plot_border = "full",
          border_width = 1.0,
          border_color = "blue")
#> Warning: The `size` argument of `element_rect()` is deprecated as of ggplot2 3.4.0.
#> ℹ Please use the `linewidth` argument instead.
#> ℹ The deprecated feature was likely used in the ggvolcano package.
#>   Please report the issue at <https://github.com/YaoxiangLi/ggvolcano/issues>.
#> This warning is displayed once per session.
#> Call `lifecycle::last_lifecycle_warnings()` to see where this warning was
#> generated.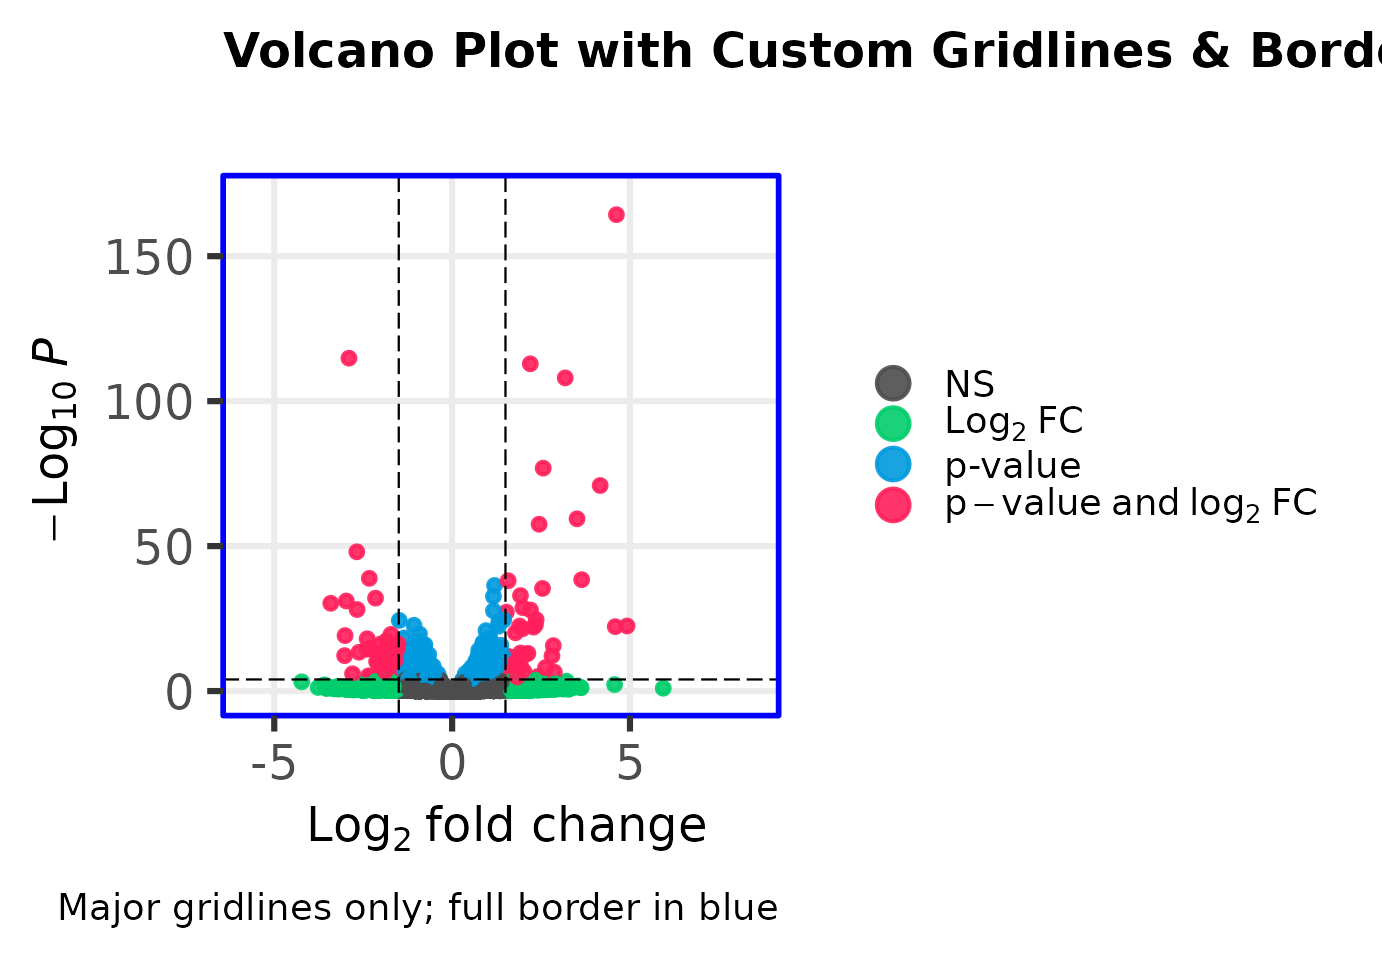
Example 6: Volcano Plot with an Additional Horizontal Line
Add an extra horizontal reference line at a custom p-value threshold.
ggvolcano(data,
          logFC_col = "log2FoldChange",
          pval_col = "pvalue",
          pval_cutoff = 0.05,
          logFC_cutoff = 1.0,
          title = "Volcano Plot with Reference Line",
          caption = "Extra horizontal line",
          horizontal_line = 1e-9,
          horizontal_line_aes = list(type = "dotted", color = "purple", width = 1))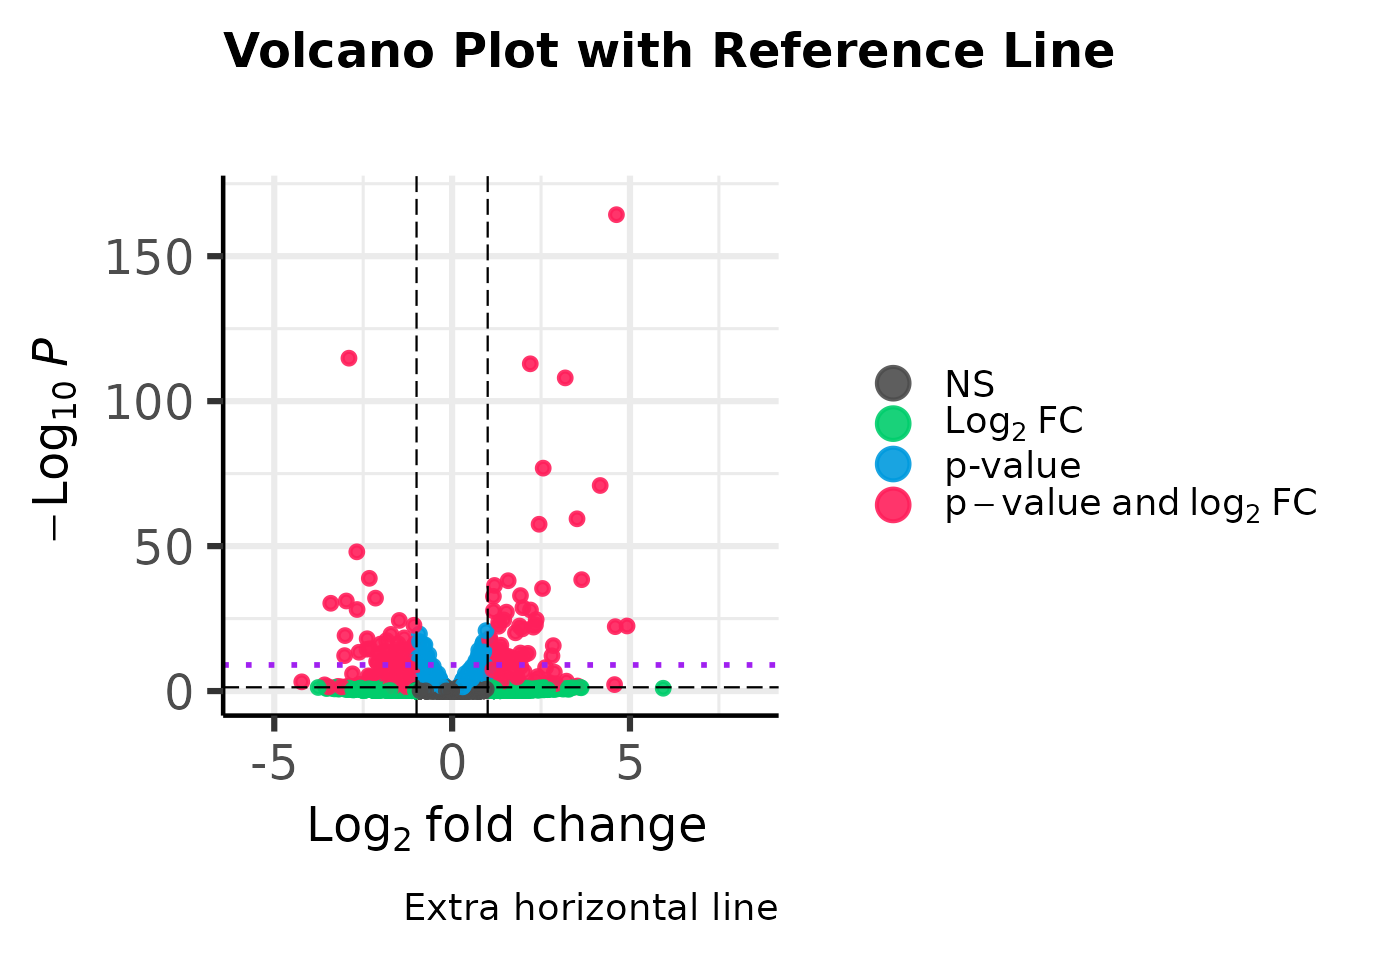
Example 7: Volcano Plot with Custom Axis Labels and Subtitle
Customize the axis labels and add a subtitle for additional context.
ggvolcano(data,
          logFC_col = "log2FoldChange",
          pval_col = "pvalue",
          pval_cutoff = 1e-6,
          logFC_cutoff = 1.0,
          xlab = "Log2 Fold Change",
          ylab = "-Log10(p-value)",
          title = "Volcano Plot with Custom Axes",
          subtitle = "Differential Expression Analysis",
          caption = "Customized axis labels and subtitle")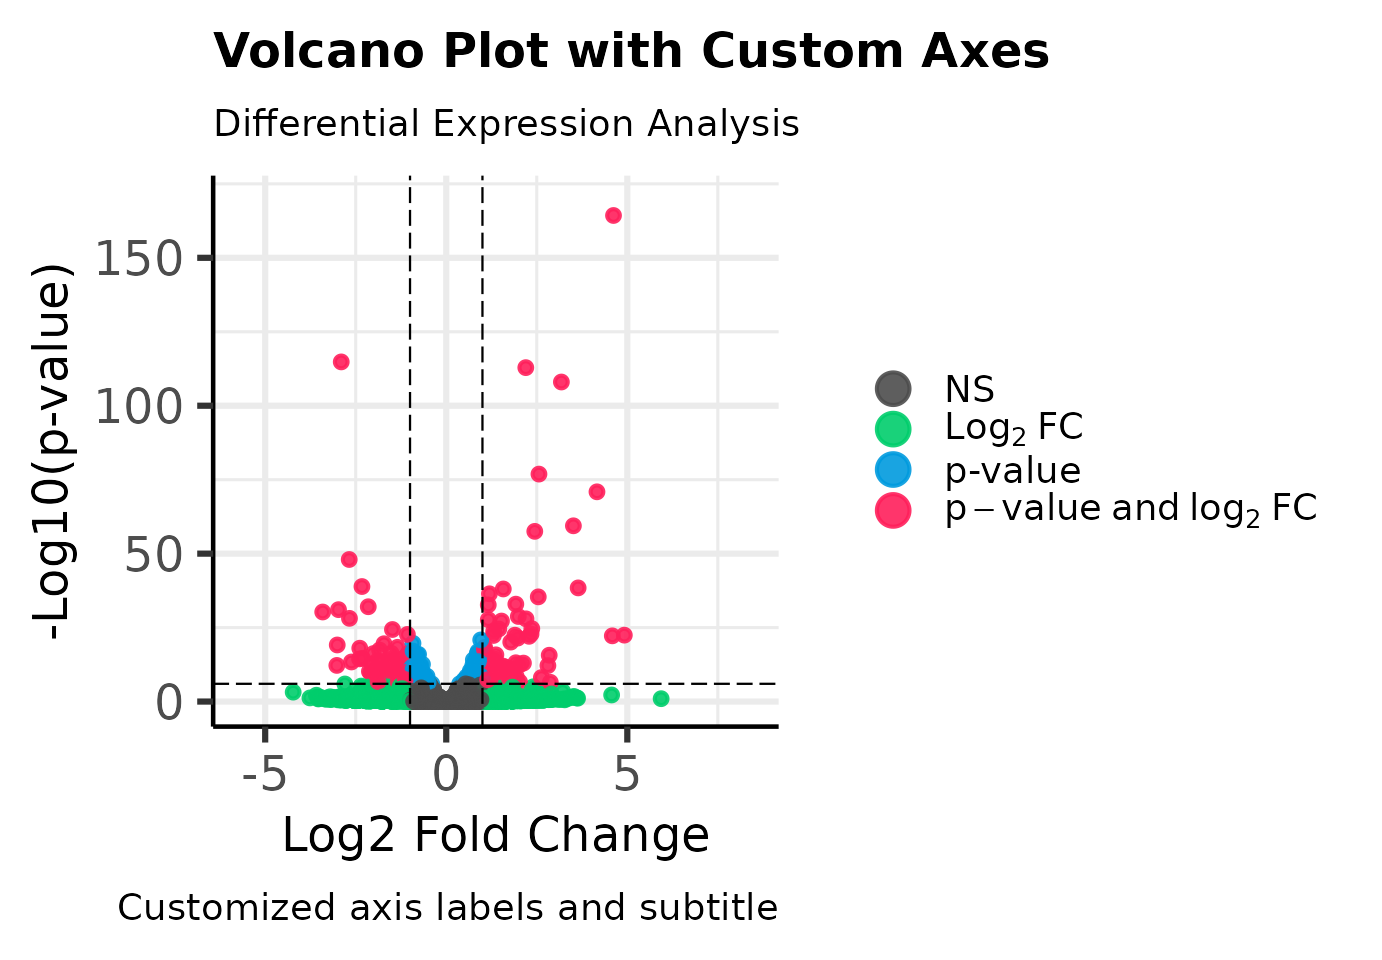
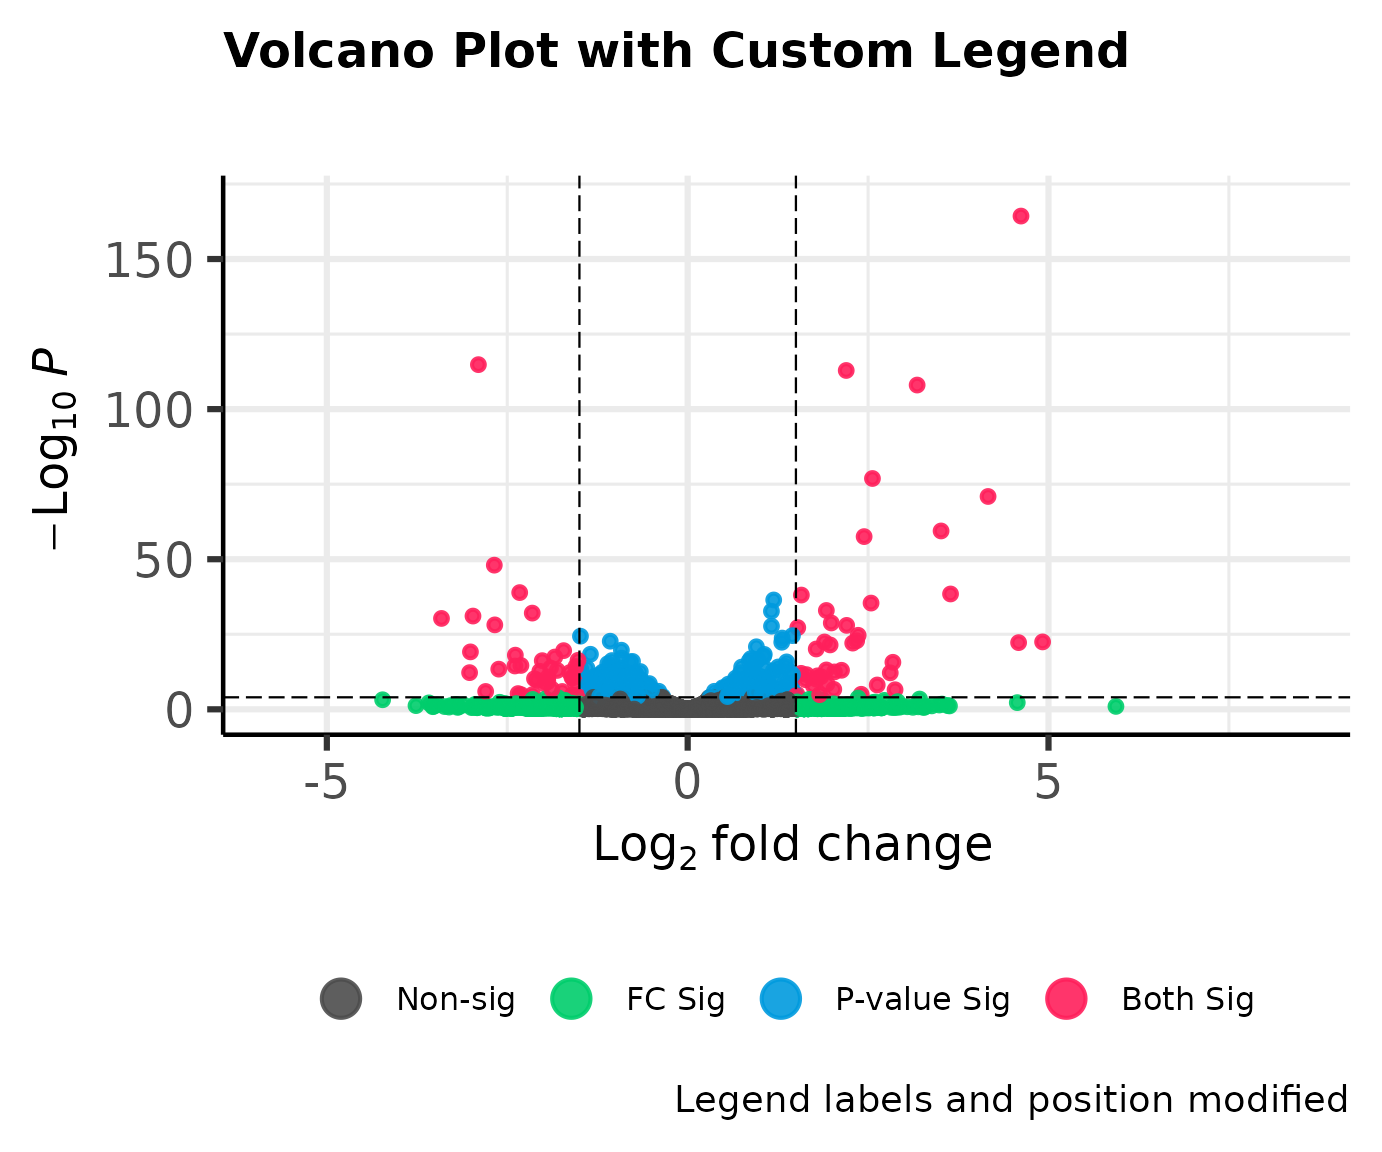
Example 8: Volcano Plot with a Custom Legend
Modify the legend labels and position for clarity.
ggvolcano(data,
          logFC_col = "log2FoldChange",
          pval_col = "pvalue",
          pval_cutoff = 1e-4,
          logFC_cutoff = 1.5,
          title = "Volcano Plot with Custom Legend",
          caption = "Legend labels and position modified",
          legend_aes = list(
            labels = c("Non-sig", "FC Sig", "P-value Sig", "Both Sig"),
            position = "bottom",
            label_size = 12,
            icon_size = 6
          ))